Blowing bubbles: financial markets in the classroom
April 2018
Run a financial market and watch bubbles emerge.
If you trade in cryptocurrency, Bitcoin in particular, last fall was quite a ride. Several students in my classes had (modest) skin in the game. Some days you could see price swings in their mood swings. When I looked out into the gallery, I saw hands gripping smartphones, faces illuminated by screens, thumbs swiping down to refresh the Coinbase app.
Every market bubble has its own special ingredients and signature details. Even so, from tulip mania to the dot com bust, certain markers appear again and again. Foremost is the simple but elusive problem of valuing the asset at hand. What is this stuff worth? the market asks. For some commodities, say oil, the calculation is a fairly straightforward process of checking scarcity, demand, and some other variables that may dictate conditions in the future, like weather. But for others, like Bitcoin, or tulips in the 17th century, or Flooze.com, the fundamental value at hand is murky – opening the door to speculation.
Kurt Vonnegut once said most stories follow one of a few “shapes” or emotional trajectories.1 Crashes seem to follow one: speculators know the good times won’t last, but believe they can get out at the right time - only to discover the exits are sealed. Battle-hardened traders and doe-eyed rookies, driven by so-called “animal spirits”, rush to join the game when prices are low and, knowing the market might crash, exit when prices reach fever pitch. Herding on a big scale pushes up the price to nose-bleed levels. Yet many find that when its time to sell, the buyers are all gone.2
Many of my students were hard-luck heros in this story when the Bitcoin market crashed. Nobody lost fortunes, but for some, it was a jarring experience. One student privately confided in me how it shattered his once unshakable confidence - like getting blindsided by a breakup he suspected was coming.
A silver lining to the cryptocurrency crash is that it piqued an interest in personal finance among students who were usually indifferent to counting pennies. It also served as a reminder to your correspondent about the limits of lecture. You can get up in front of the class and talk about a market and draw lots of diagrams, but nothing brings it to life, the good, bad and the ugly, like seeing prices - and your bank account - changing right before your eyes.
So I wondered how I could “grow” asset bubble during class. Then I discovered that somebody had already done the heavy lifting. Vecon Lab, brainchild of University of Virginia economist Charles Holt and many collaborators, has tons of free economic experiments perfect for classrooms. For the simulation of a financial market, there is the Limit Order Asset Market.
A trading floor on the classroom floor
The experiment is pretty simple. Students are traders and start off with electronic cash (e.g. $50 experimental dollars or EDs) and shares (e.g. 6) in a generic asset. Over the course of some number of trading periods (I used 20), traders earn income in three ways: 1) selling shares, which depends on the going share price; 2) owning shares, which depends on the dividend, the return on a share; and 3) interest on cash, which is fixed, similar to a savings account (e.g. $0.10).3 To spice things up I announced that the asset was in fact shares in my new company, Much Dogecoin, a consultancy for Dogecoin ($DOGE).4
The experiment is run client-server: I (the server) ran the market on my computer, and each student (the client) used a computer to to join the market from the participant log-in screen. Trading was executed as a “call market”. At the start of a trading period, traders could post “bids” or buy orders (how many shares to buy at a proposed price), and/or “asks” or sell orders (how many shares to sell at a proposed price). The title “Limit Order” comes from the fact that the proposed price in bids and asks are the maximum or “limit” price at which a buyer or seller will trade.
When the trading period ends, the market is “called”, meaning the software running the market looks at all the bids and asks and calculates the price that “clears” the market. The market-clearing price is simply the price that roughly sets share supply equal to share demand.5 The key here is the market is perfectly competitive: no trader can single-handedly influence the permit price. Therefore the price that emerges through trade will capture the perceived benefits and costs traders attach to the shares - and the underlying asset (my Dogecoin consultancy).
While such call markets are nothing special (they are still used in wholesale electricity markets), the Limit Order Asset Market has a trick up its sleeve. Students knew they would trade for twenty rounds and then count their winnings once the market closes for good. But no real-life financial market has such a definite end. How then can the experiment reflect reality?
The trick is to allow the dividend to fluctuate in all but the last period, when all shares pay a fixed dividend. In any round but the last the dividend could either be High ($H$, e.g $1.00) or Low ($L$, e.g. $0.40), with one of the two chosen at random by the server. Hence the expected value of a dividend in any period is $D = (H + L)/2$, or $0.70.
Now imagine trading were allowed to continue forever. Traders would balance the value of trading now with the value of trading in the future. To grasp the value of a future trade, traders consider the present value, which is simply how much a reward to be had in the future is worth now. If traders are risk neutral - they neither seek or shy from risky business - then it can be shown that the final, fixed dividend of the asset is $D/r$, or $7.00, if we suppose the fixed interest rate on cash $r$ is $0.10. The basic idea is to show that the value of an infinite sum converges to $D/r$. If the present value $V$ of the asset $t$ periods from now is given by $V = D/(1+r)^t$ (where $D$ is the dividend), and if trading goes on forever, then the stream or sum of present values is given by the infinite sum $V = D/(1+r) + … + D/(1+r)^t$, which converges to $D/r$.6
This trick sets the stage for speculation. If the final dividend captures the value of the asset if trading were infinite and traders were cool customers, then the value of the asset in any period will be the same as the value in the final period. Therefore bubbles emerge when the market-clearing price of the asset exceeds the final dividend. This inflation is what I was looking for. Would our traders keep calm and toe the theoretical line? Or would they rush into a frenzy, pump up the price, and try to get while the getting was good?
Sell, sell, sell!
Classroom experiments are always fun, but students really had a blast with this one. A grosse ambiance came over the room as students got into the spirit while I oversaw the trading floor on my computer and streamed classical music on Spotify. (Suggestions for hip hop and heavy metal were declined lest we disturb neighboring classrooms.) Laser focused on making as much as they could (even though they knew I was not going to convert their profits into real dough), the traders egged each other on. In an interesting turn of events mirroring the dog-eat-dog nature of high finance, some even conspired to game the market, communicating in a hidden code of gestures, winks and nods. But great expectations early on shortly gave way to great anxieties. By the end it only took one glance at the room to pick out who was coming home with roast beef and who was coming home with none.
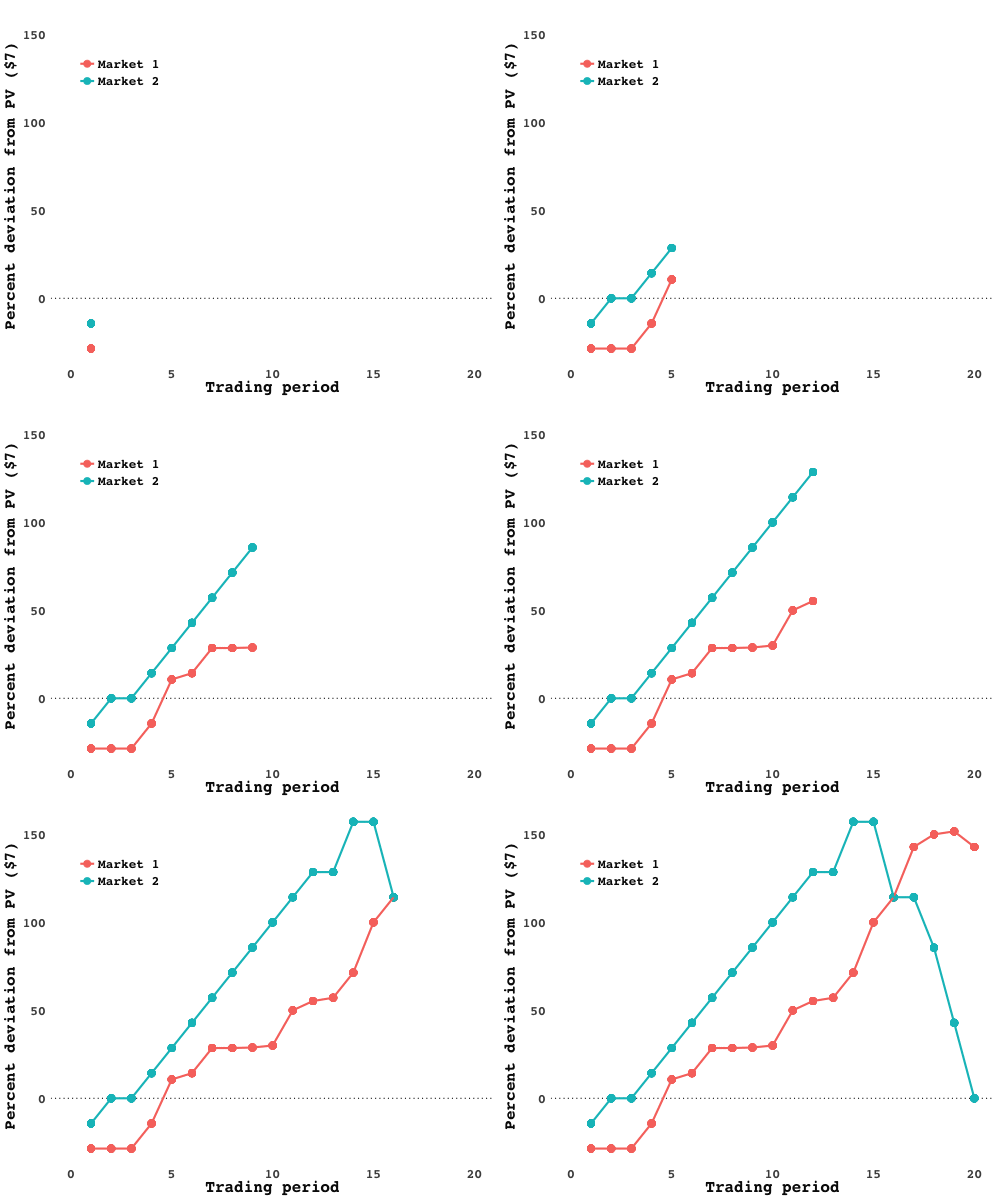
I ran the experiment with two different groups of students (Market 1 and Market 2), and in each one, spectacular bubbles emerged. In Market 2, following an initial phase in which the price was below $7 as traders felt out the market, prices soared nearly 150% above the fundamental asset value - only to plummet after the fifteenth period, five periods before the end. It was much of the same in Market 1. Plotting the market-clearing prices over time lays bare the frenzy:

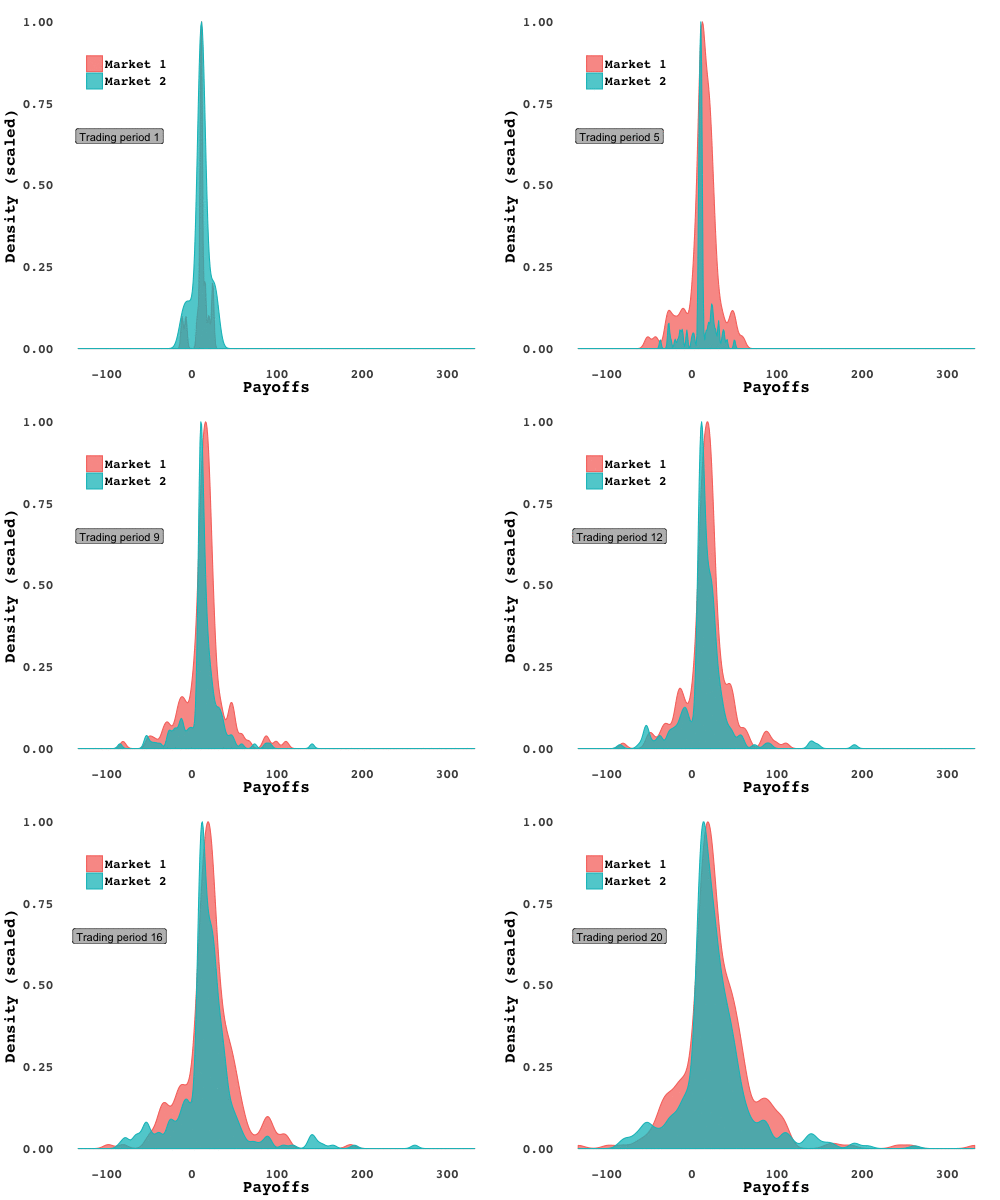
Trader profits likewise spread out over time, with a few traders amassing (relatively) dizzying wealth, while others barely ended up with pennies to scratch together (again, relative):

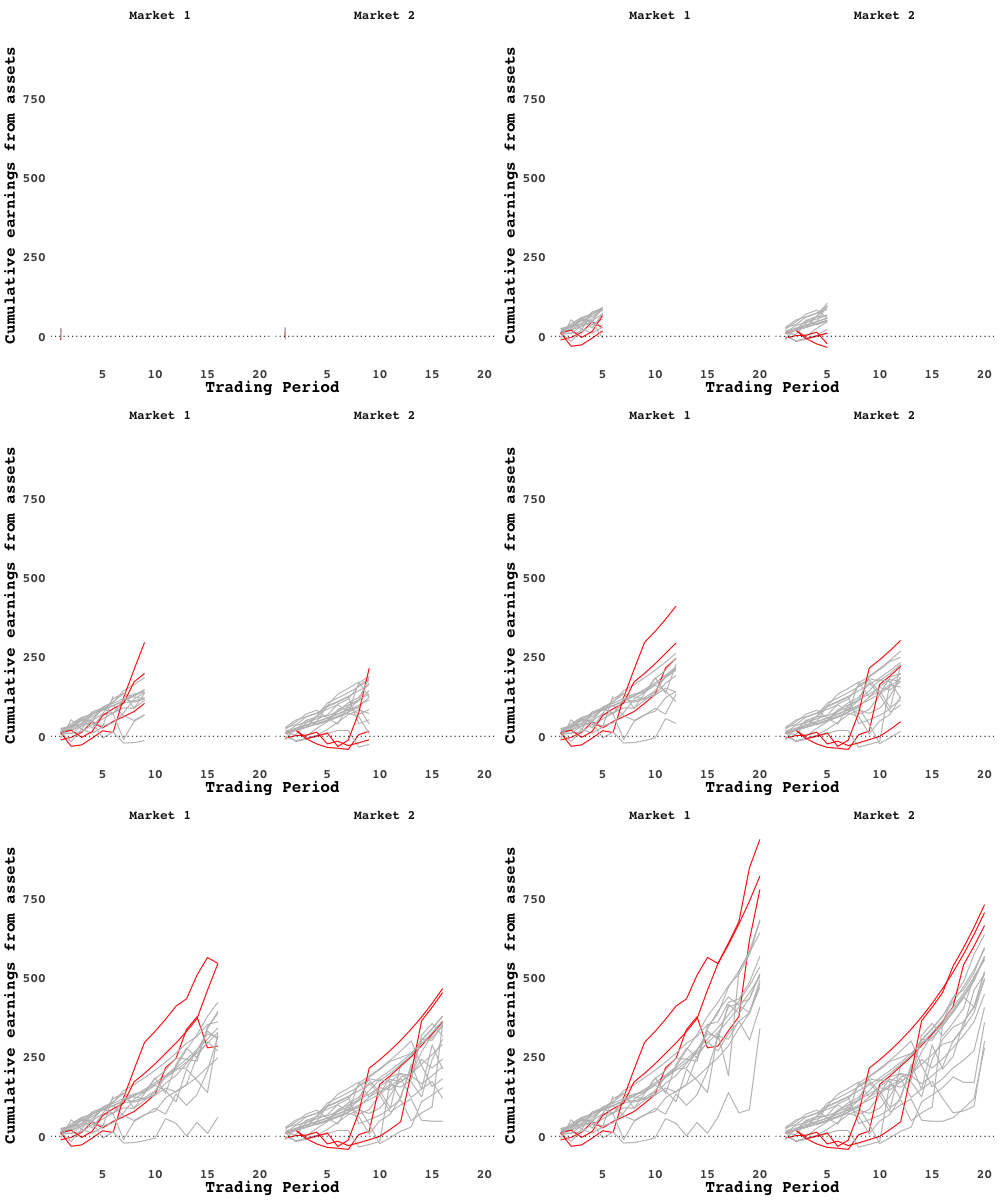
You could pick out the breadwinners with a quick study of earnings over time. Cumulative gains from assets (how much a trader earned from holding and selling shares, added up over time) plotted over trading periods shows how a few traders, in red, separated from the pack early on:

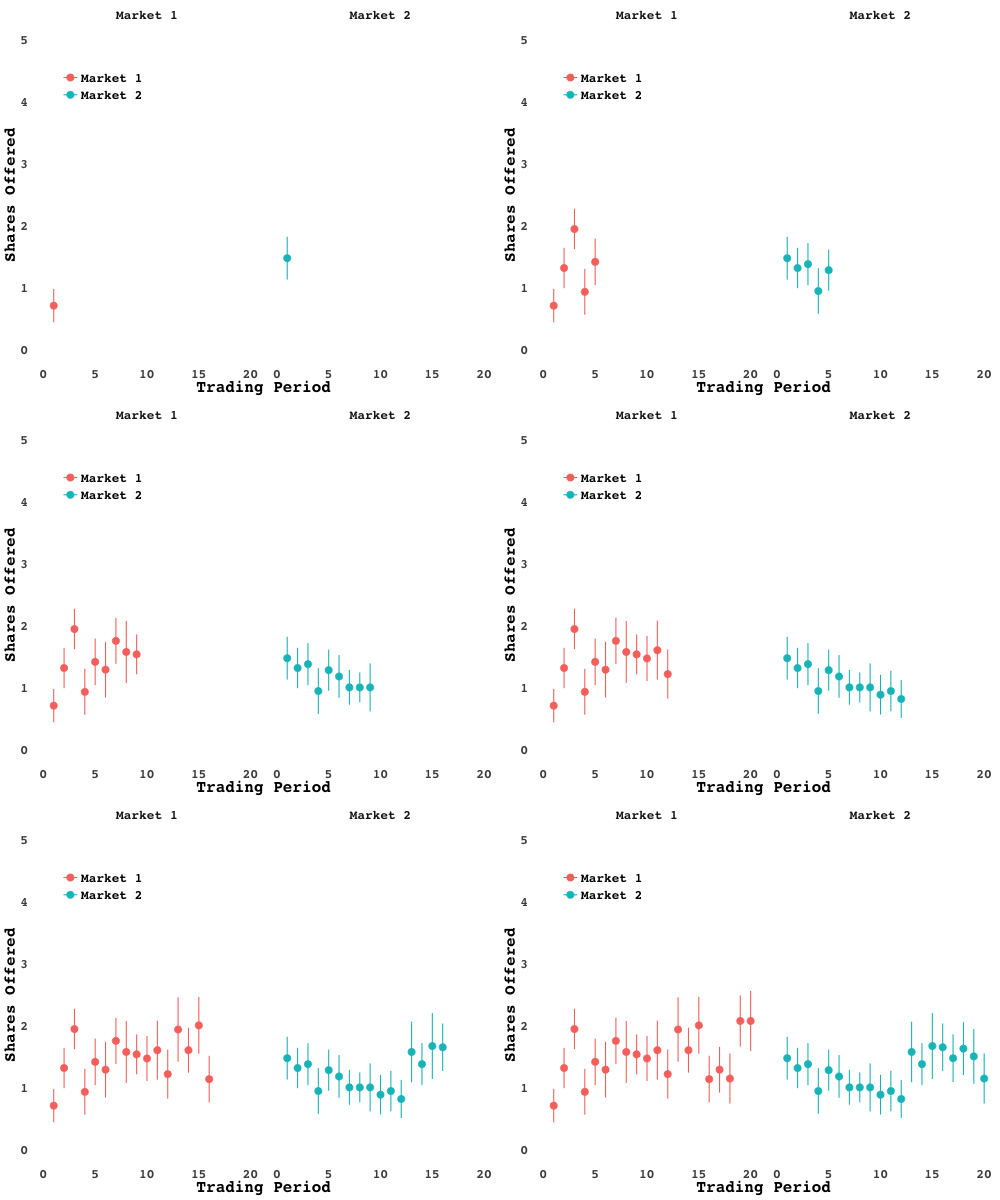
Notice how the separation is not immediate. In fact, those traders actually did worse than their peers in the early periods. When the market closed and passions cooled I surveyed the trading floor. The breadwinners all chose a similar strategy: start out by gathering up as many shares as you can, wait for the price to climb, then sell. That gains can be had by exploiting scarcity is no mystery. But nobody was quite sure when the price would summited. In fact, when you look at the average number of asks, you see waves go up and down, as traders try to time their exits:

Sure enough, when the breadwinners were pressed, they admitted they too were unsure when the market would unravel. Some even felt it was all a matter of luck - and a matter of exploiting the exuberance of others.
No sleep till the Forbes list
Still, what fascinated me was how cold hard deliberation seemed to matter less than dead reckoning. Those top earners could offer no clear insight as to why they got out when they did. They relied on feeling - taking the temperature of the room and gauging the sentiment of their peers, all based on outward expressions of emotion. Exactly what is inside their minds is locked away. This was a key part of our post-market discussion. Many were startled to see how trading decisions were driven by a combination of sense and sentiment – and what exactly what was that combination was hidden from consciousness.
The point of the experiment was to show how speculation can ensue when traders are neither risk neutral nor certain about the asset’s fundamental value. Importantly, bubbles in our experimental markets, just as in many real markets, was driven not by ignorance over market mechanisms, but by a belief that they could be the ones who take the money and run by pumping up the price and getting out at the right time.
Students seemed to take a lot away from the experience. Watching sepculation play out in an abstract market also laid bare the reality that bubbles can occur in a variety of markets.7 For the babes in the wood it was something of a crash course in finance. I wondered more about the so-called veterans, the students who rode the cryptocurrency wave in the fall and winter of 2017. As one said when she left the class: “No sleep till the Forbes list.”
Data and code
The data and code to reproduce the figures are available on GitHub.
-
Researchers at the University of Vermont seem to confirm the Vonnegut hypothesis in a recent paper. ↩
-
This is painting a picture in broad strokes. For a great exposition on why stock markets crash see Didier Sornette’s “Why Stock Markets Crash: Critical Events in Complex Financial Systems”. ↩
-
The experimenter can tune endowments, shares, dividends, the interest rate, and many other variables. To keep things simple I used the default values. The main thing is to choose parameters so traders are encouraged to actually trade and not just hold cash. ↩
-
Dogecoin is one of the more tongue-in-cheek cyrptocurrencies out there, what with it being named after an internet meme and used mostly as a means for Redditors to “tip” each other for funny comments. ↩
-
An example from the instructions: “Suppose that the only bids submitted in a round are 60 cents for one share and 20 for another, and the only asks are 10 for one share and 40 for another. The clearing price cannot be above 40, since there would be 2 shares offered for sale, but only 1 share that buyers are willing to purchase. Conversely, at any price below 20, there are 2 shares demanded, but only 1 share is offered for sale. Notice that any price between 20 and 40 could be a market-clearing price, and when this happens the market maker will use the midpoint of the interval, which is 30 in this case. Thus the person who offered to pay 60 would only have to pay 30 cents, and the person who offered to take 10 would actually receive 30 cents for the share sold.” ↩
-
Chapter 18 of Charlie Holt’s textbook Markets, Games and Strategic Behavior (the companion book to Vecon Lab) goes into more detail why. ↩
-
The Economist recently reported on a so-called “carbon bubble” in which firms that do too little to comply with the Paris Agreement and heed climate risks are overvalued. Investors in these firms, it seems, either do not believe the risks are dear, or if they do, they feel confident of a timely sale, insuring them against the repercussions. The author(s) write: “Neither the signing of the Paris agreement nor its ratification a year later had an impact on global energy stocks, according to a working paper by Thomas Sterner and Samson Mukanjari of Gothenburg University, whether because these events were already priced in or markets never believed the commitments.” ↩